The old green robot is retired. Stonk Bot now wears the studio's mark for it: a rounded window with a line rising inside it, ending in a small glowing dot. It's a window you look through, not a button you press, because the tool only reads a portfolio and never trades.
The same mark is the browser-tab icon and the home-screen icon, and the "Bot" in the name takes the tool's own green from the brand guide, kept separate from the green that means "up today".
Holdings stay in date order, and gain/loss colors (and the tax column's owed/benefit colors) are now worked out from each sale's own numbers, on totals rows too, instead of copied from the row above, which had spread a few wrong colors.
Empty rows between tables are trimmed after each sync. Moving rows up turned out to break two kinds of formula (one that Excel quietly "repaired" by deleting it, one that ended up adding itself up); both were found, fixed at the source and repaired in the affected sheets.
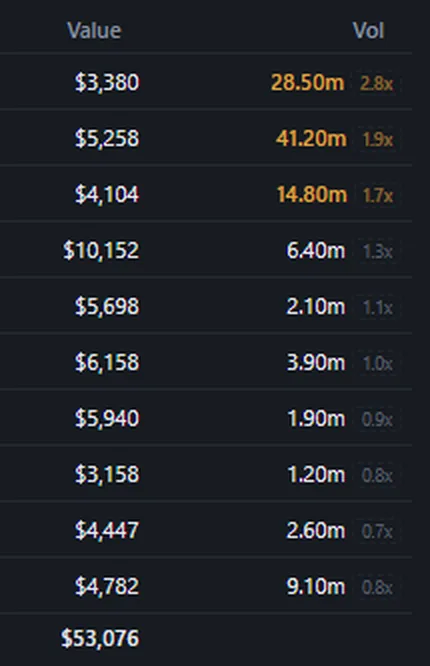
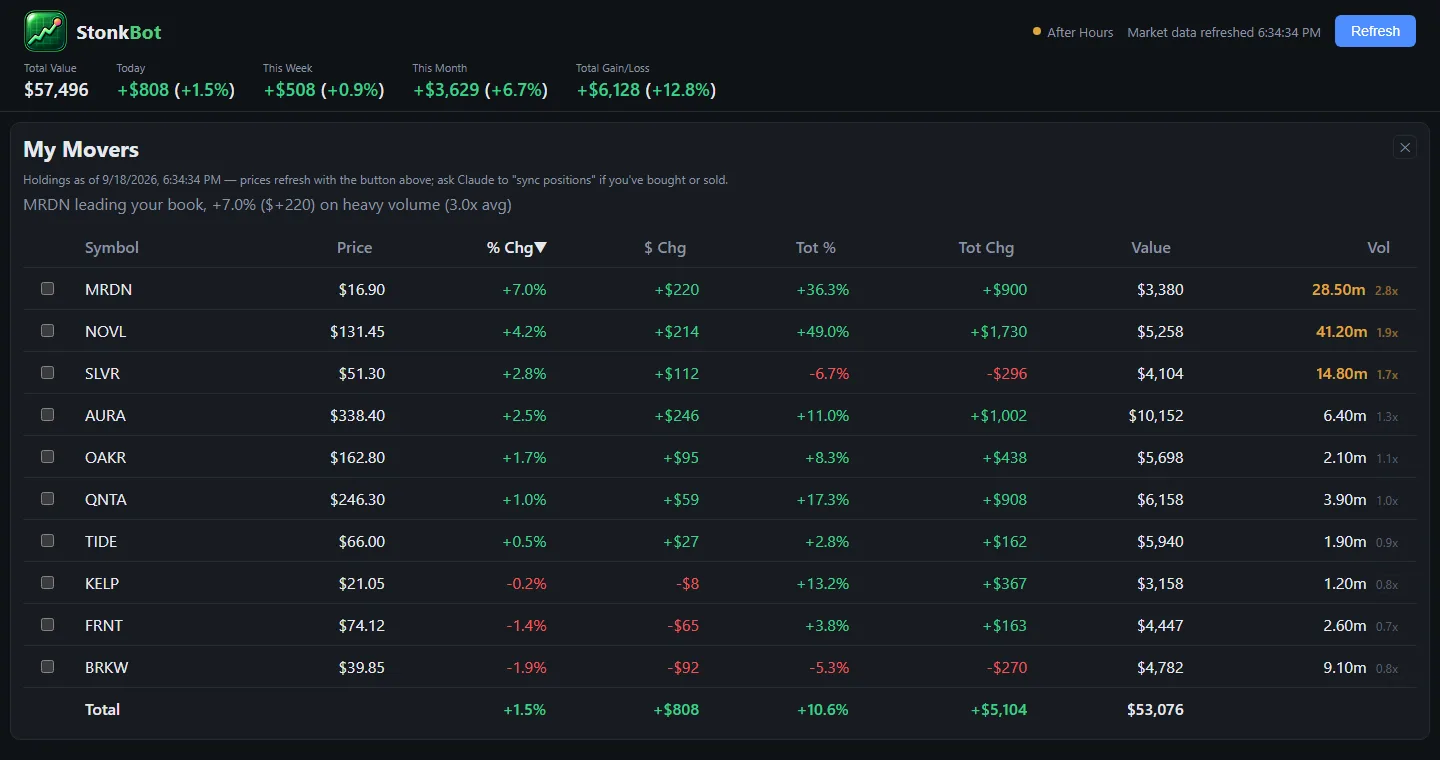
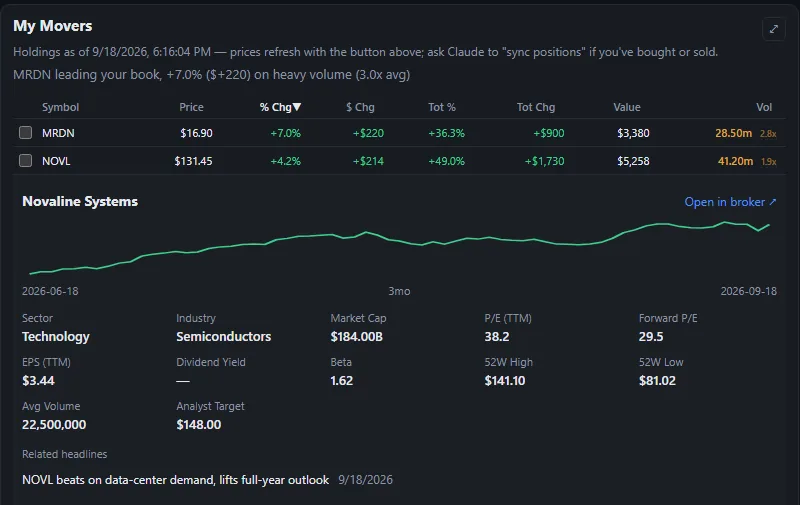
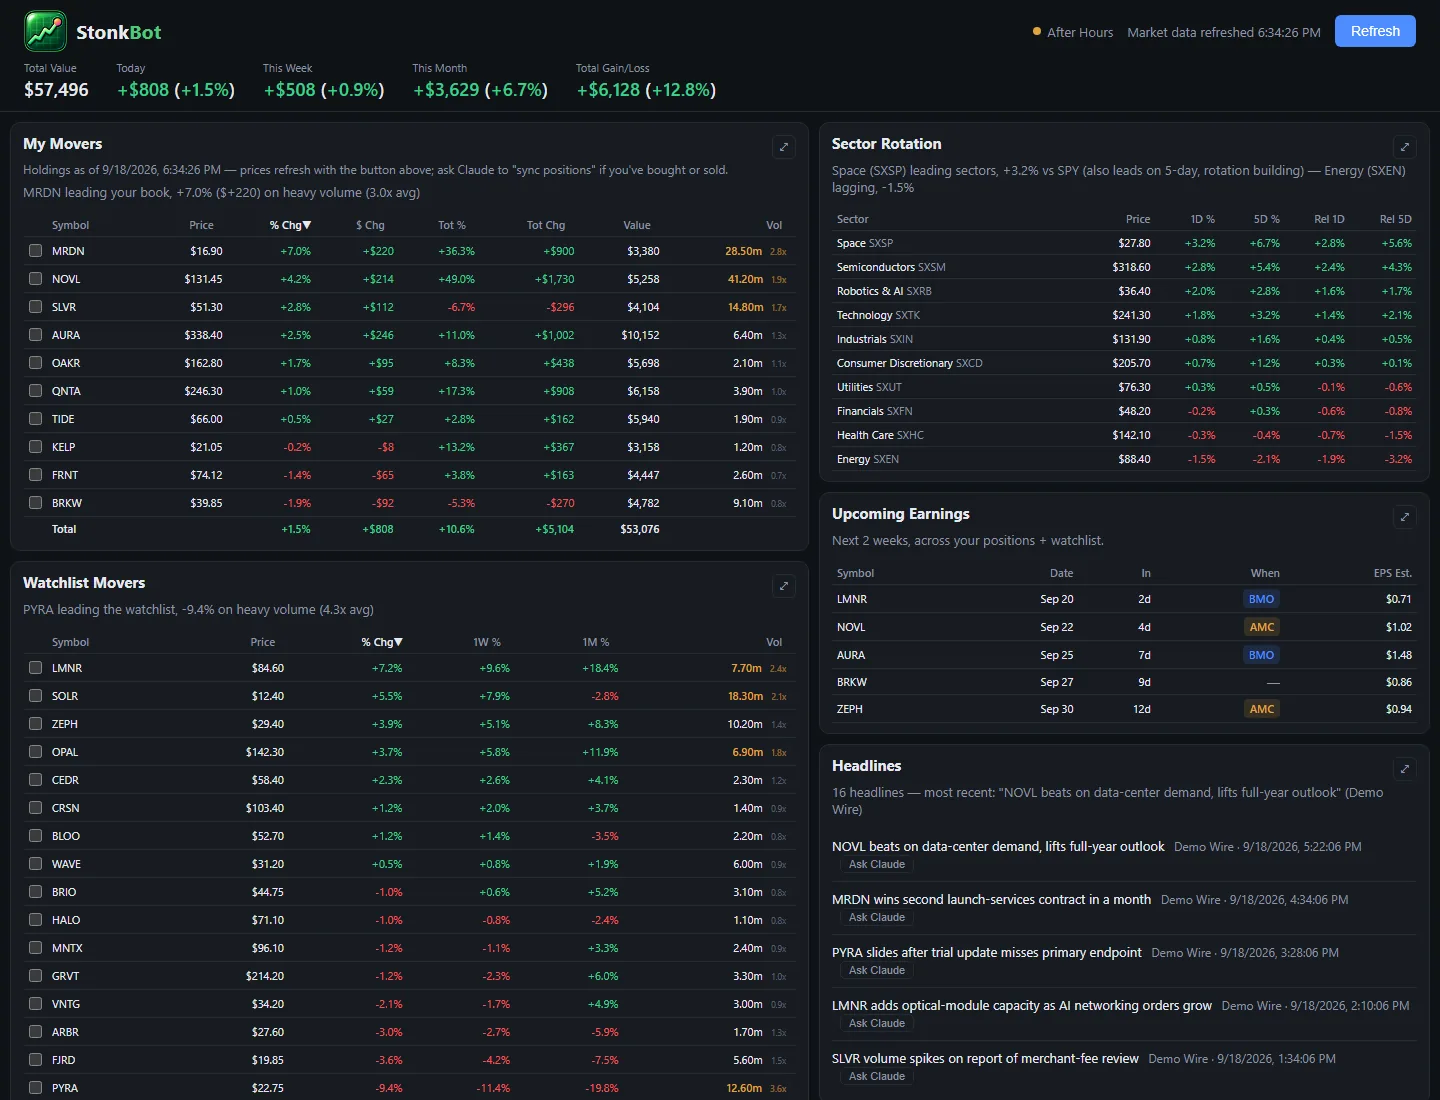
A small badge next to each volume figure compares today's volume so far with the average volume by the same time of day over the last month or so. At 10am a stock can look quiet next to a whole day's average and still be trading three times its usual morning; the badge shows that. Heavy volume is highlighted, and after the close the last reading stays, faded.
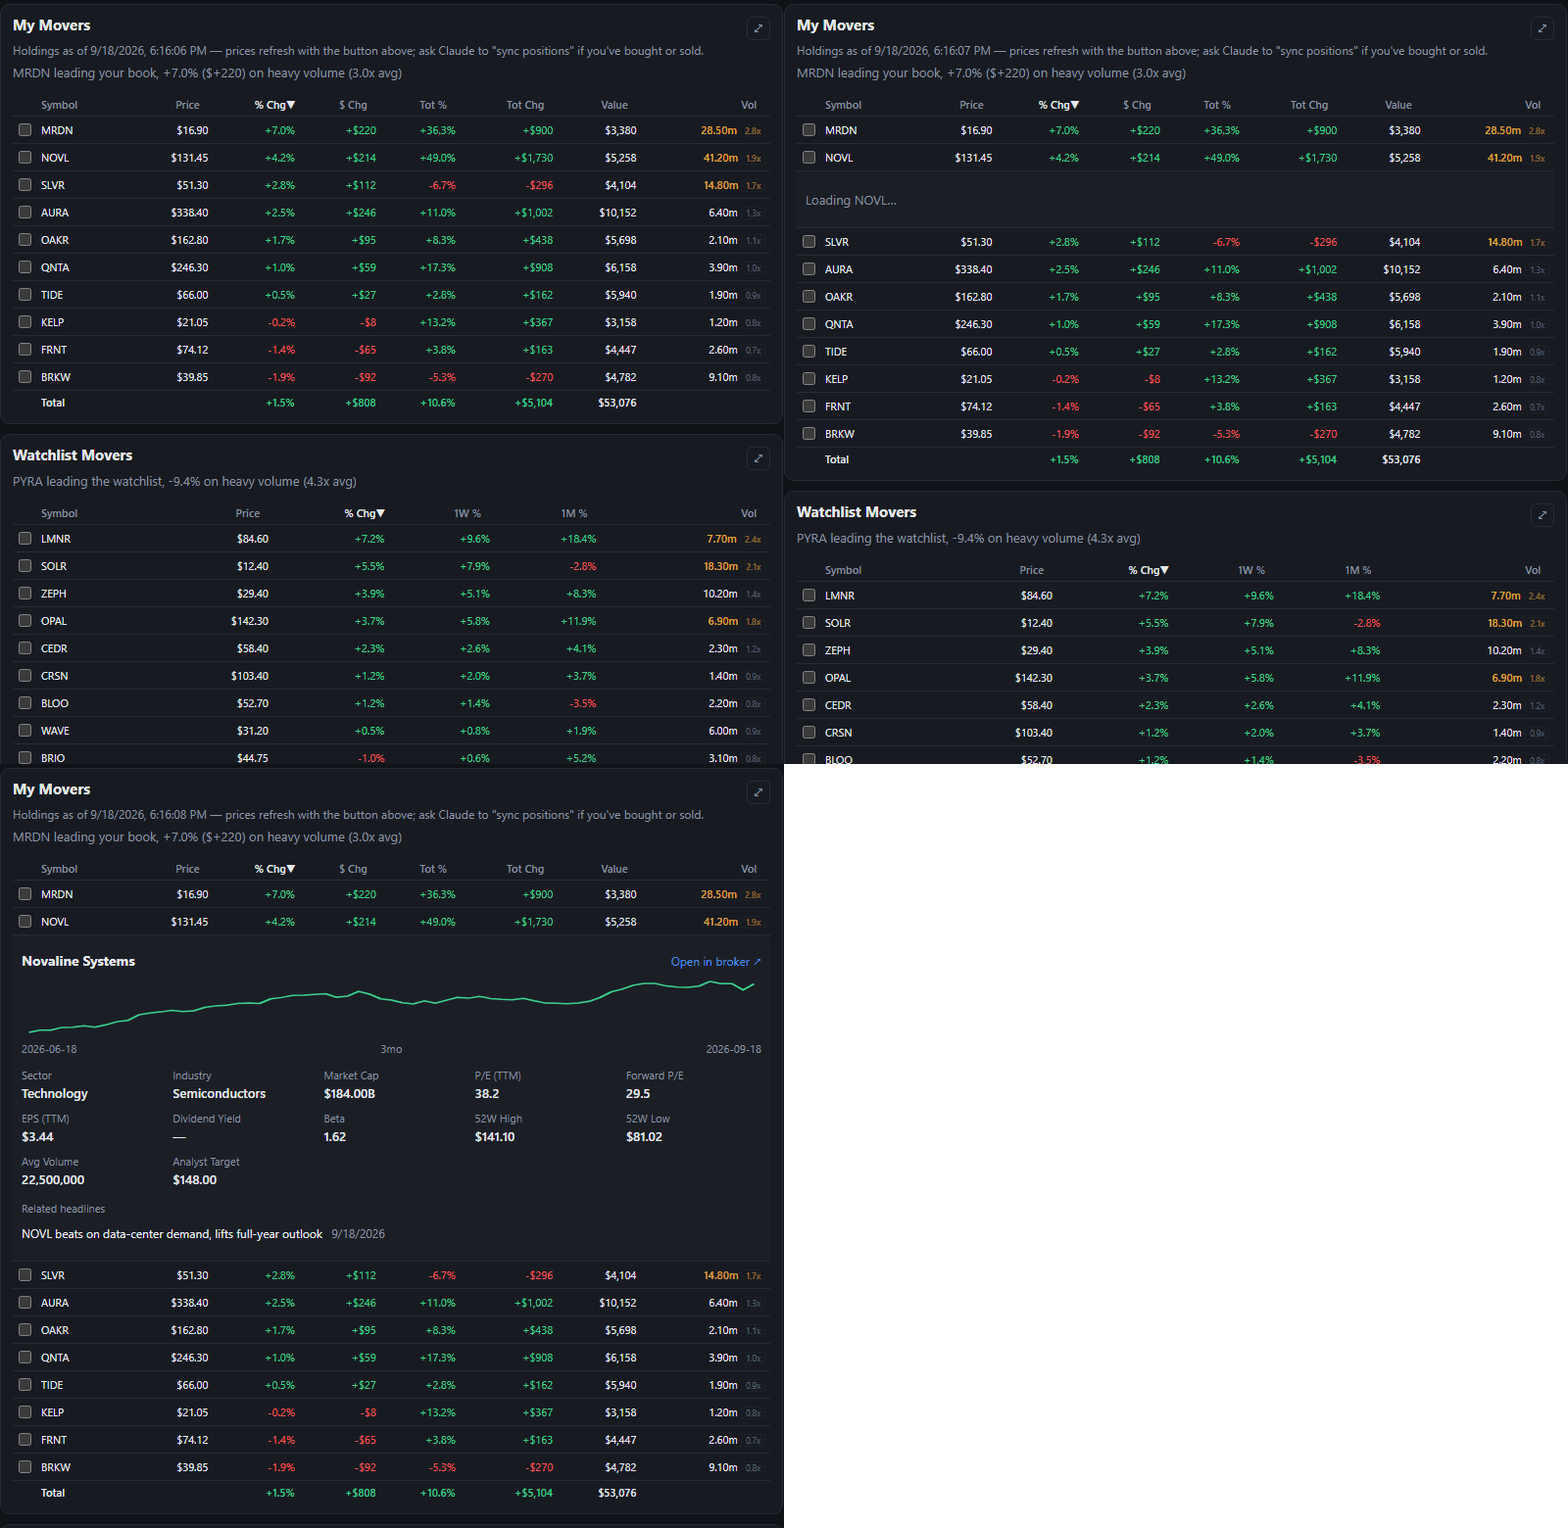
Clicking a symbol anywhere opens a panel right under its row: a three-month price line, sector and industry, market cap, P/E, EPS, dividend yield, beta, the 52-week range, the analysts' target, matching headlines and a link to its page at the brokerage.
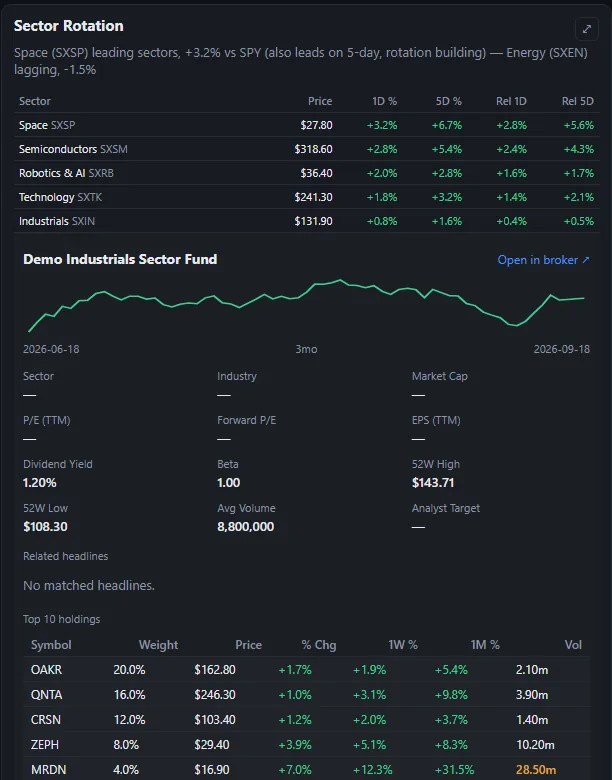
A sector fund shows its top holdings with their own moves, and each of those is clickable too.
Every sync also appends each new brokerage order (filled, canceled or still queued) to an append-only ledger workbook, newest first, with one sheet per account and summary tabs by security and by month.
When the tracking spreadsheet ever looks wrong, the ledger is the record to check it against, instead of reconstructing history from scratch.
Weekly and monthly gains now come from a daily history of each account's actual total value: ending value, minus starting value, minus deposits, plus withdrawals.
The first version multiplied today's holdings by old prices. That quietly ignored anything sold during the period and credited positions for weeks they weren't held. It took a careful check against the brokerage's own chart to catch.
History can't be invented after the fact, so a tile says "Building history…" until a snapshot old enough exists. Total Value now includes cash, and hovering over Today splits it into the regular session and after hours.
"Sync my positions" now also updates a month-by-month tracking workbook: one row for every purchase lot, not one per stock.
It spots new buys and sales by comparing the brokerage's open lots with the sheet, records each sale at its real price from the trade history, and files it as short- or long-term with an estimated tax and after-tax return.
A new month gets its own tab, carrying open positions forward. The script writes into the workbook's existing layout and formulas without disturbing its formatting.
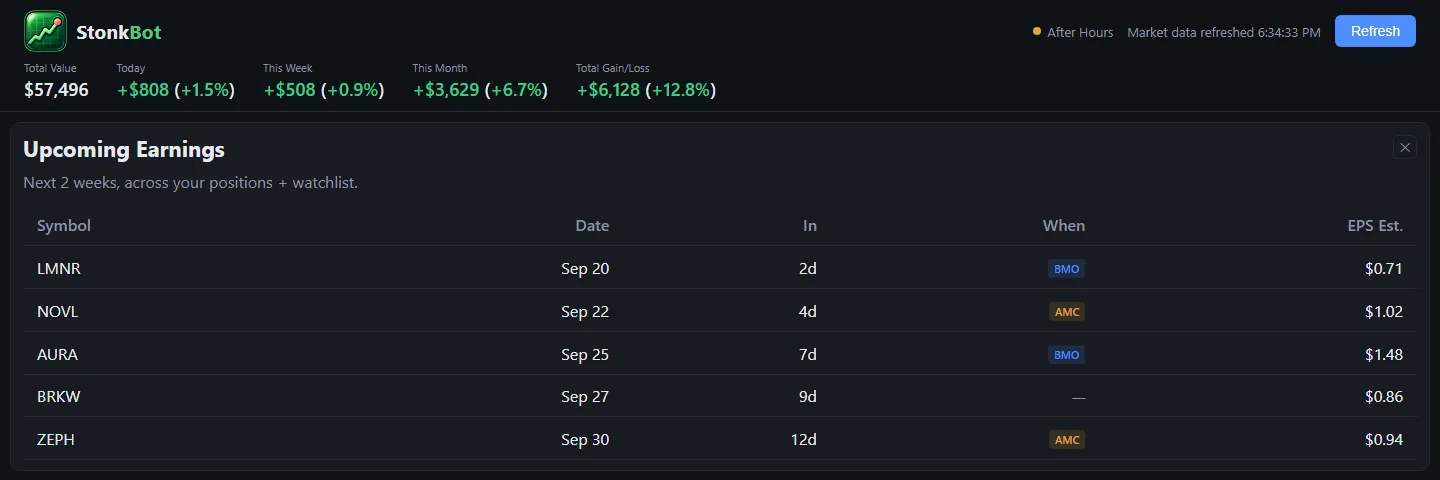
A panel of every earnings report due in the next two weeks across holdings and the watchlist, with how many days away it is, the EPS estimate, and whether it lands before the open or after the close. The free data source only has a placeholder for that timing, so it's filled in from the brokerage's own calendar during a sync.
The header's Total Gain/Loss adds the profit already locked in from sold positions to the paper gain on what's still held, instead of forgetting a stock the moment it's sold. Hovering explains what's included and when it was last synced.
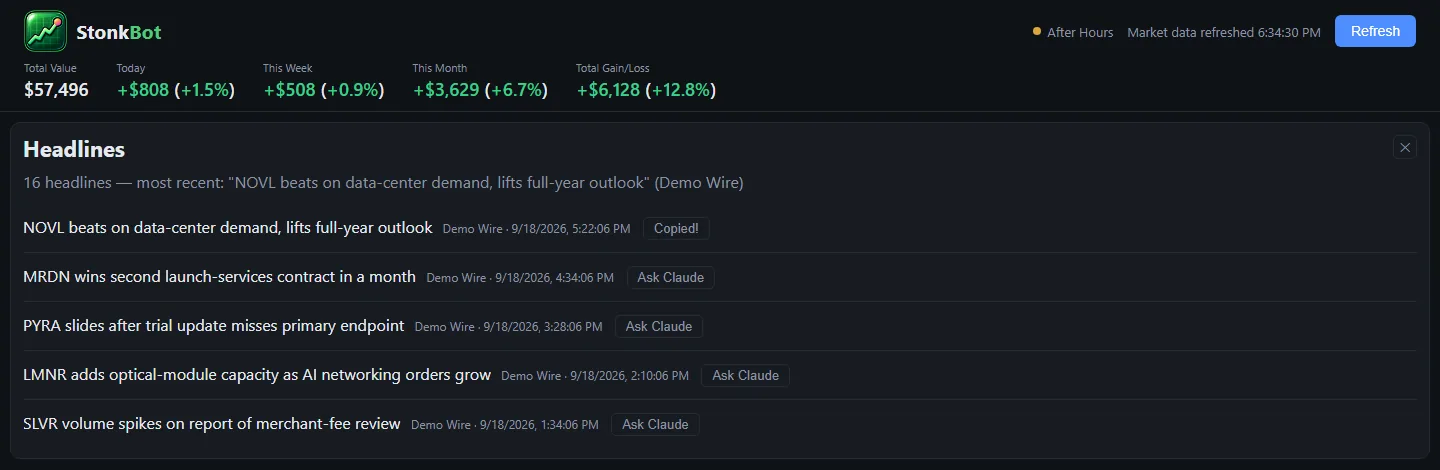
Headlines now come from a news feed scoped to the tickers held and watched. General front-page feeds rarely named any of them, so the panel felt empty.
Every headline has an Ask Claude button: it opens a new chat and copies a ready-made prompt that asks for a summary, a fact-check where the claim is checkable, and whether it matters.
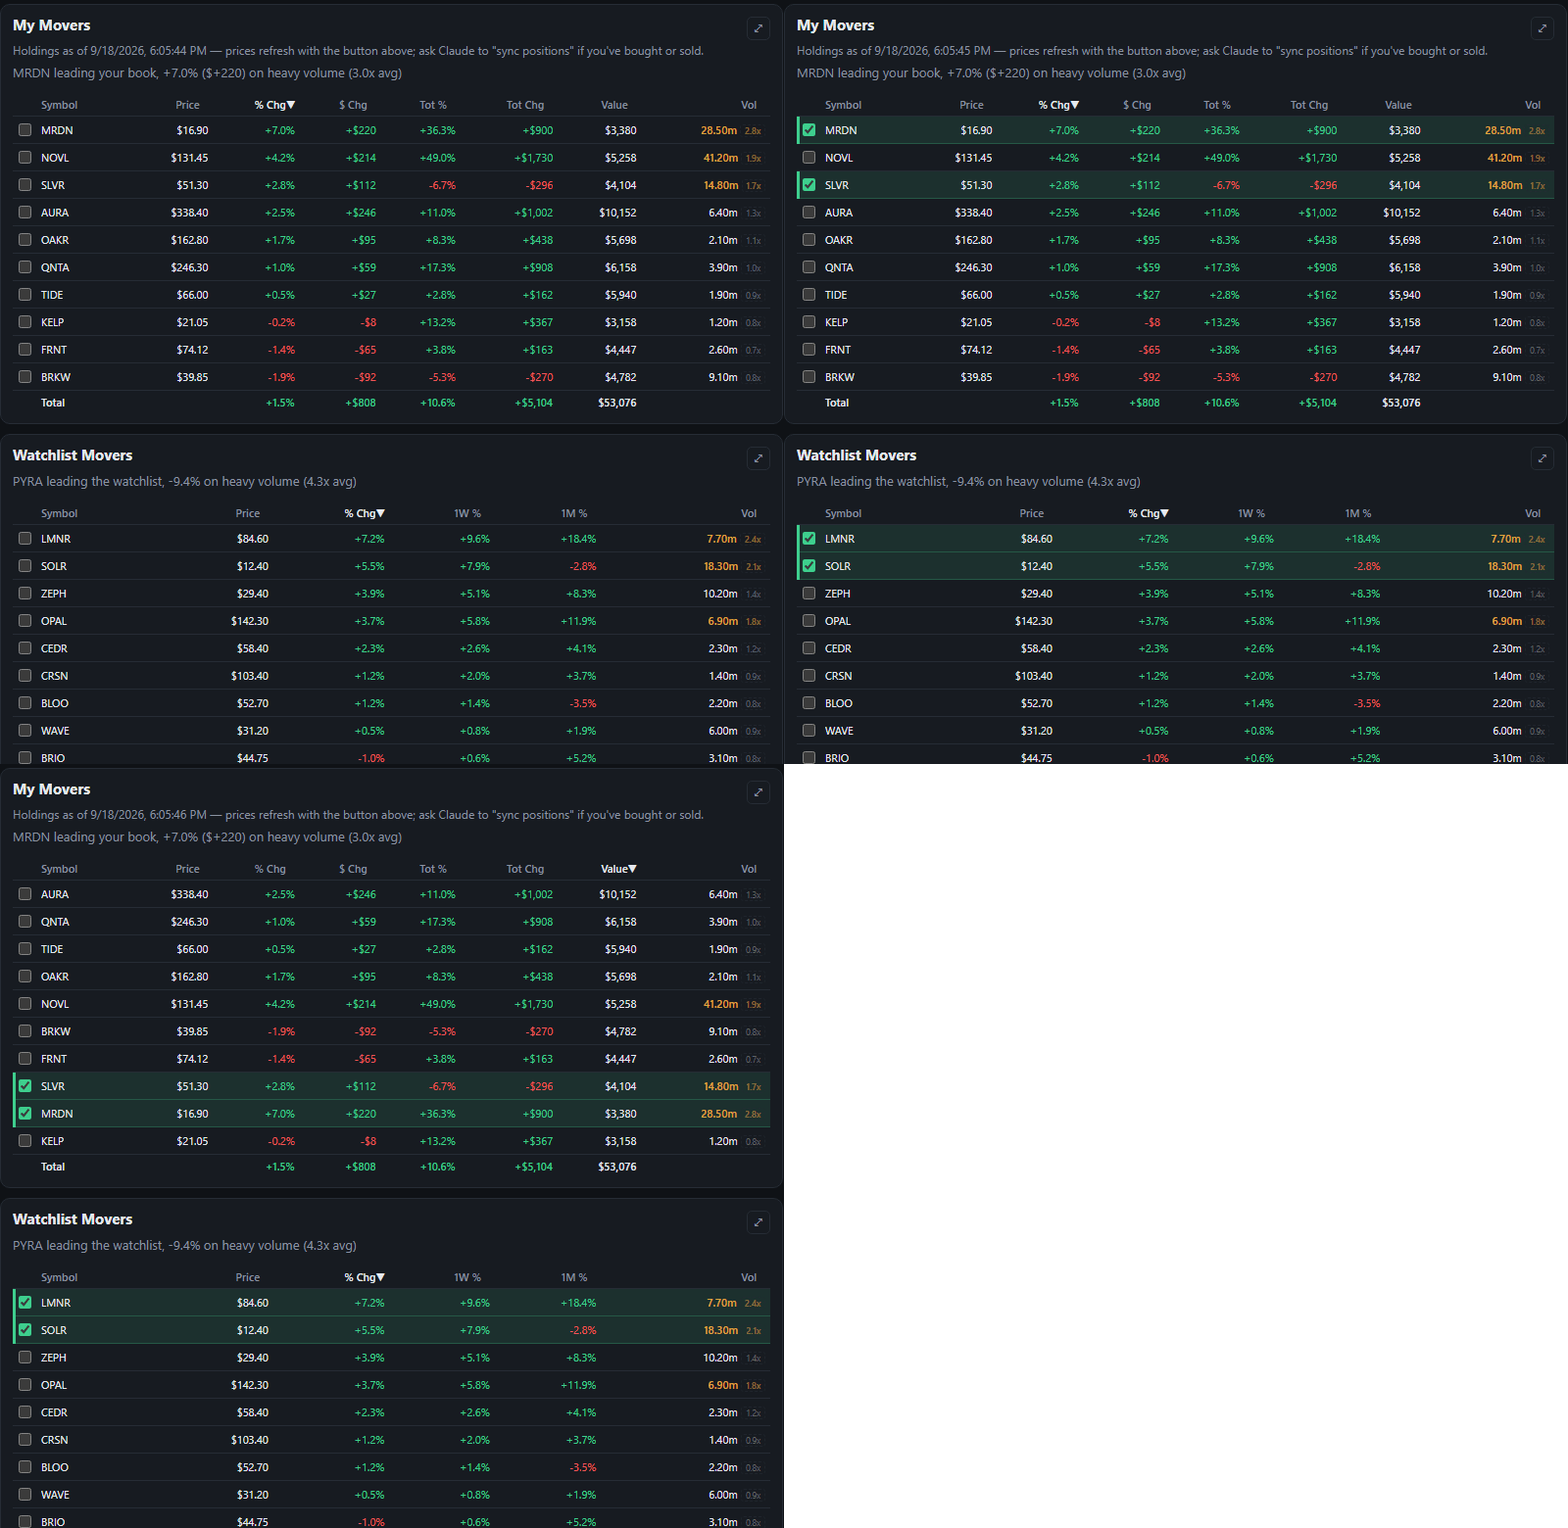
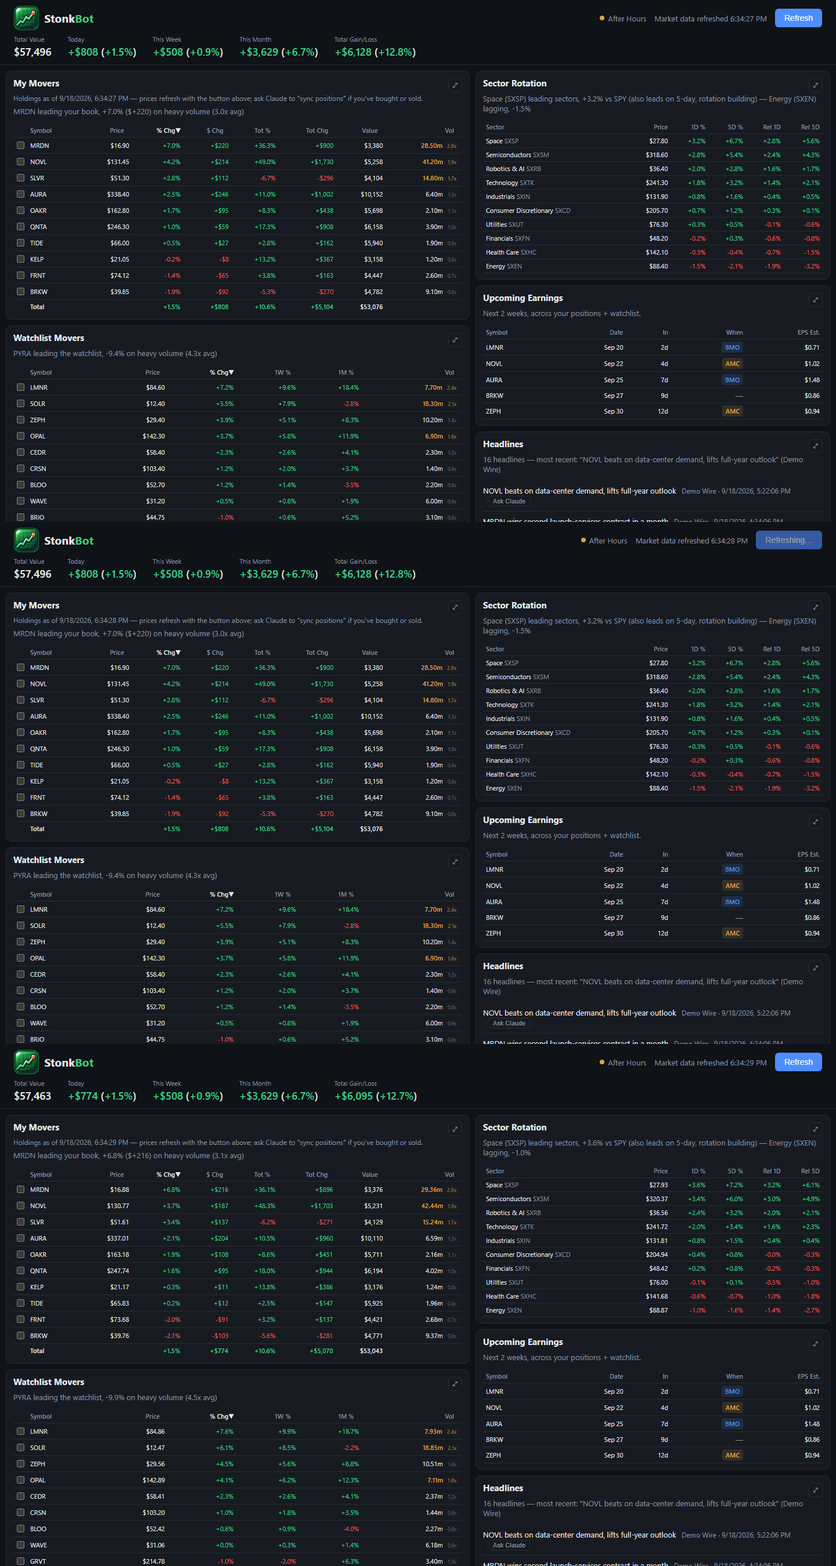
A small local web app that answers "what moved, and why might it have?" at a glance. My Movers lists every holding by today's move, with the dollar change, the total gain on each position, its value and its volume against the average, plus a totals row weighted by dollars rather than a plain average of percentages.
Watchlist Movers does the same for names being watched, and Sector Rotation ranks sector funds by how they're doing against the S&P 500 over one and five days, so a rotation shows up early.
Every panel opens with a one-line summary in plain English ("Space leading sectors, also leads on 5-day, rotation building").
The Refresh button pulls free market data and re-prices everything. Which stocks are actually held comes from asking Claude to "sync my positions": Claude reads the brokerage through its own connector, so no brokerage login is ever stored on the machine.
A double-click launcher starts it, or just opens the browser if it's already running (2026-08-11).

 Stonk Bot September 18, 2026 Iteration 13