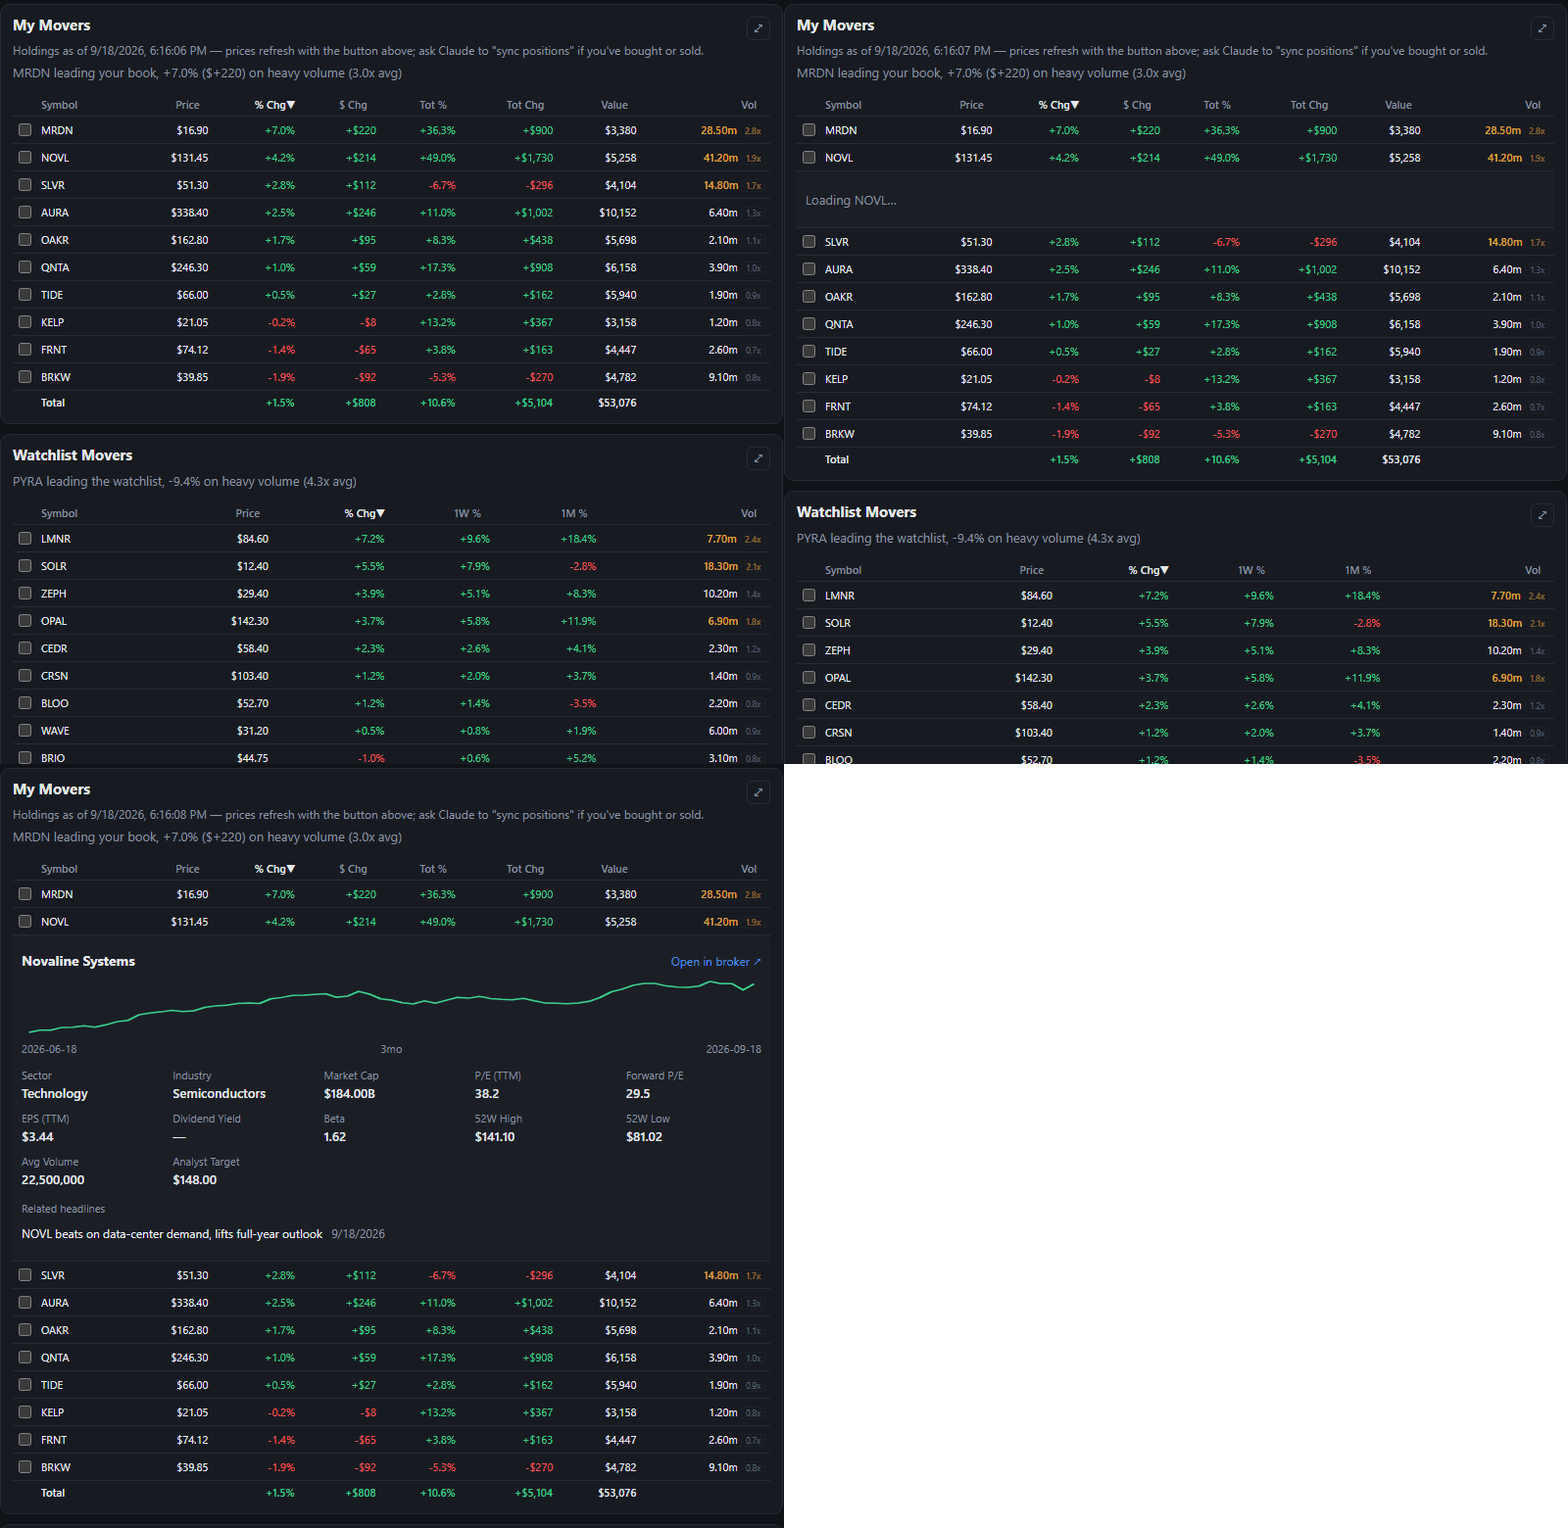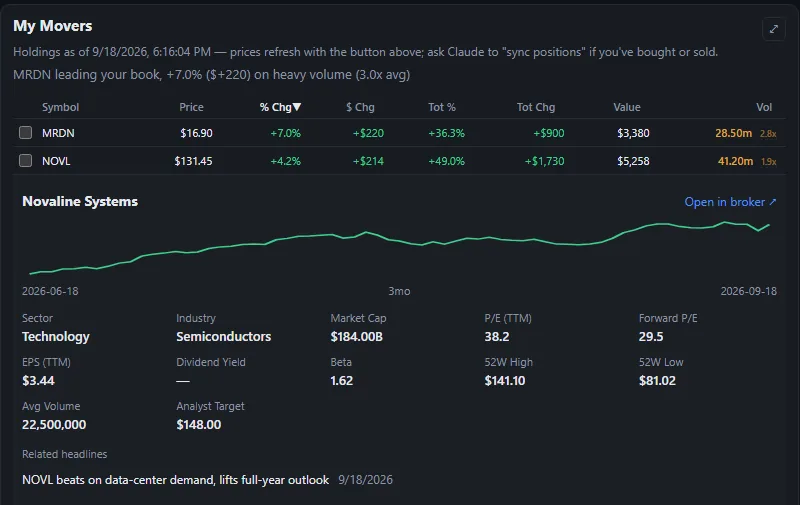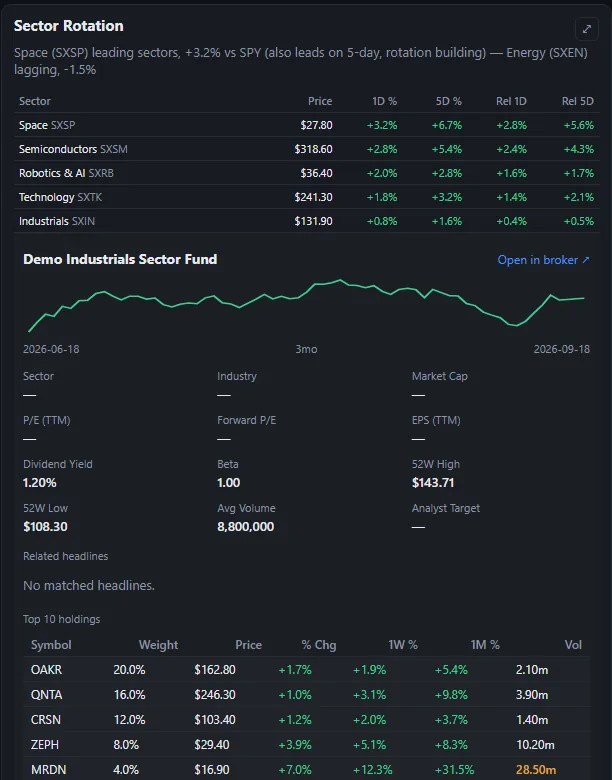
- Clicking a symbol anywhere opens a panel right under its row: a three-month price line, sector and industry, market cap, P/E, EPS, dividend yield, beta, the 52-week range, the analysts' target, matching headlines and a link to its page at the brokerage.
- A sector fund shows its top holdings with their own moves, and each of those is clickable too.
 Stonk Bot September 4, 2026 (approximate) Iteration 8
Click any ticker for its details