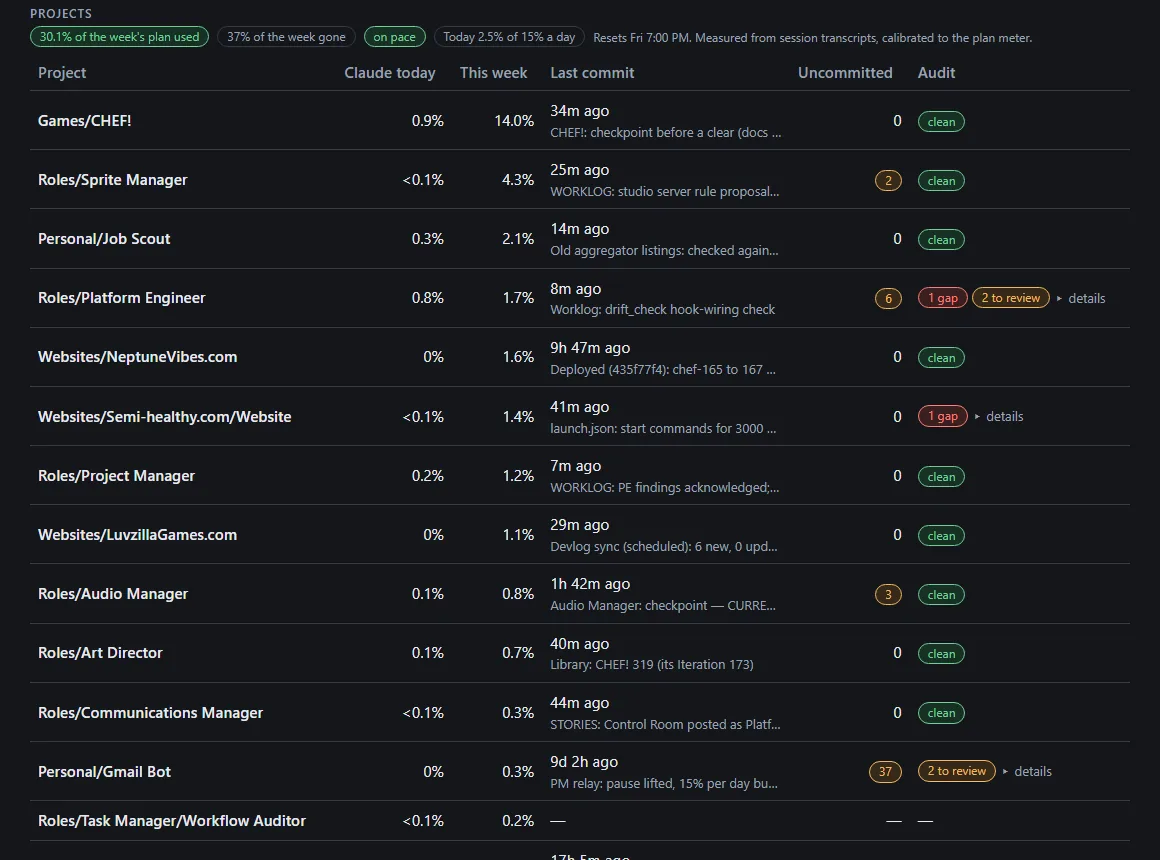
Control Room gained a Projects table: every project's share of the weekly AI plan used today and this week, its last commit, how many files are uncommitted, and the latest findings of the hourly workflow audit, which open with a click.
A line above it gives the week's pace: how much of the plan is used, how much of the week has gone, and today against the studio's daily budget. The owner can see at a glance whether the studio is spending faster than the week allows, and which project is doing the spending.
The numbers come from the tools that already own them, not copies. The usage report behind them got about thirty-five times faster, because it now skips transcripts written before the week began. It also counts work done by helper agents toward the project that started them, instead of under a folder of their own.
Building it showed the usage scale had drifted since it was last set. The report put the week at 46% while the plan's own meter said 30%. It was recalibrated against the meter, and the two now agree.

 Platform Engineer